The Debug Log is like Salesforce’s diary. It jots down all the activities happening within the platform when certain actions occur. The Debug Log chronicles transaction patterns, database tasks, and so much more.
What will you learn:
- Get an overview of the different types of debug logs in Salesforce.
- Learn how to analyze debug logs in Salesforce.
- Discover the importance of analyzing debug logs in Salesforce.
What are the different types of Debug Logs in Salesforce?
In Salesforce, debugging is integral to ensuring seamless operations, be it user activities, custom code, system processes, or even UI interactions. Given the platform’s depth and breadth, Salesforce offers a variety of Debug Logs tailored to different needs. Let’s explore each type and its specific use cases.
1. User Debug Logs:
User Debug Logs primarily track user-initiated actions. These could be related to the standard Salesforce UI, custom applications, or API calls initiated by a particular user.
- Use Case: If an end-user reports unexpected behaviour or errors during their interactions, User Debug Logs can be instrumental in pinpointing the issue.
- Setup and Management: To capture logs for specific users:
-
- Navigate to the Debug Logs page in Salesforce setup.
- Use the ‘New’ button to set up a new Trace Flag for the desired user.
- Specify the log levels for different categories and set the duration for capturing the logs.

2. Apex Debug Logs:
Apex Debug Logs are focused on the custom Apex code within Salesforce. This includes triggers, classes, and other custom codes.
- Use Case: When developers need to understand the flow of their code, validate the execution of specific logic, or identify issues, Apex Debug Logs come into play.
- Details: These logs capture:
- SOQL and DML operations and their outcomes.
- Exceptions or errors in the Apex code.
- Governor limits consumption, helping developers ensure their code is efficient.
3. System Debug Logs:
System Debug Logs provide insights into automated processes that run in the background.
- Use Case: Useful when debugging issues related to scheduled Apex, batch jobs, or integrations with external systems.
- Understanding Usage: Unlike user-driven activities, system processes might run at specified intervals or based on certain triggers. System Debug Logs become the primary source of truth when anomalies are reported or suspected in these processes.
4. Visualforce Debug Logs:
Tailored to the Visualforce pages in Salesforce, these logs are about user interactions with these custom pages.
- Use Case: When there’s an error on a Visualforce page or if a developer needs to understand how user actions on a page trigger various operations, Visualforce Debug Logs are consulted.
- Details: Logs capture details such as:
- The sequence of operations triggered by the page.
- Duration and outcome of each operation.
- Any exceptions or errors tied to the page’s logic.
5. Platform Events Debug Logs:
This deals with the logs for platform event messages and custom notifications that Salesforce apps can publish and subscribe to.
- Use Case: Extremely beneficial in event-driven architecture, allowing developers to ensure that events are published and consumed as expected.
- Importance: In modern Salesforce implementations, event-driven architecture is gaining prominence. Platform Events Debug Logs ensure that these asynchronous communications between different system parts are happening correctly.
How do I Analyze Debug Logs in Salesforce?
As Salesforce instances grow in complexity with custom code, integrations, and user activities, understanding how to analyze these logs becomes crucial. Let’s explore this process step by step.
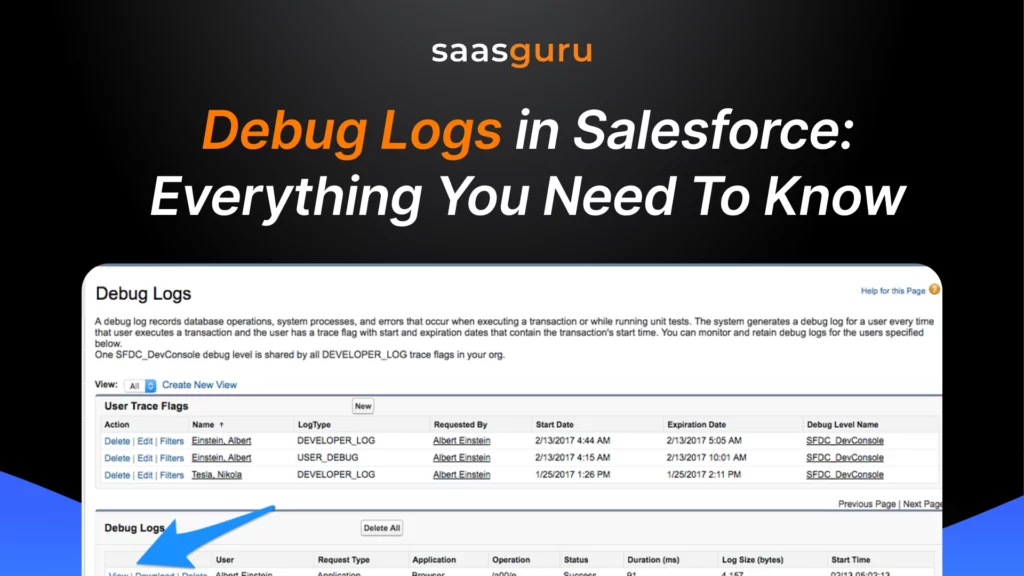
1. Accessing Debug Logs:
Navigating to the Debug Logs page:
- From Salesforce Setup, enter “Debug Logs” in the Quick Find box.
- Select “Debug Logs” from the dropdown to access the logs page.
Setting up debug log filters:
- Use the ‘New’ button to create a new Trace Flag.
- Specify which user or class you want to monitor.
- Define the log categories and levels (more on this in the next section).
2. Understanding Debug Log Levels:
Debug logs have various granularity levels, each capturing different amounts of information.
Different Levels:
-
- Finest: Captures the most detailed information.
- Debug: General debugging information.
- Info: General operational messages that describe what’s happening in your app.
- Warn: Warnings, i.e., issues that aren’t errors but might need attention.
- Error: Errors that have caused an operation to fail.
Setting the appropriate debug level:
- You can set different levels for each log category when creating or editing a Trace Flag.
- Adjust these based on what you are troubleshooting. For a broad overview, ‘Info’ might suffice, while intricate code debugging requires ‘Finest.’
3. Reading the Log:
Breaking down the structure:
- Timestamp: Indicates when the event occurred.
- Event: The type of event, like CODE_UNIT_STARTED or SOQL_EXECUTE_BEGIN.
- Detail: Further information about the event.
Identifying common patterns or issues: As you grow familiar with logs, you’ll recognize patterns and learn to spot anomalies or errors quickly. Common problems might include governor limit warnings, unexpected method calls, or long-running processes.
4. Using Log Analysis Tools:
Overview of Developer Console:
- Accessible from the Salesforce UI, the Developer Console provides an interactive interface to view and analyze logs.
- It offers features like log panels, checkpoints, and query execution.
Third-party tools and plugins: Various external tools are designed to make log analysis more intuitive. Illuminated Cloud or FuseKit can simplify log parsing, highlight errors, or visualize log data.
5. Best Practices:
- Keeping logs clean and manageable: Regularly review and delete old logs. Excessive old logs can clutter the interface and make finding recent logs cumbersome.
- Setting appropriate expiration for trace flags: Instead of running a trace flag indefinitely, set it to expire after a reasonable duration, say a few hours or days, based on the troubleshooting need.
Tips for efficient log analysis:
- Familiarise yourself with the common event types and their meanings.
- Use keyword search to quickly jump to relevant sections.
- Take advantage of log colour-coding in tools like the Developer Console.
Why do we use Debug Log in Salesforce?
Let’s delve deeper into why the Debug Log is indispensable for Salesforce professionals.
1. Importance of Troubleshooting and Understanding Code Behavior:
Before resolving any issue, understanding the root cause is essential. The Debug Log acts as a window into the Salesforce operations, enabling developers and administrators to pinpoint exactly how and why specific code behaves in a certain way. By examining the log, one can determine if the code executed as intended, which functions or triggers fired, and the sequence of operations. This insight is invaluable for ensuring that implementations align with business logic and requirements.
2. Debugging Governor Limit Issues:
In its wisdom to ensure optimal Performance for all its tenants, Salesforce imposes certain execution limits, commonly known as governor limits. These may relate to the number of SOQL queries, DML operations, or the total script execution time, to name a few. Exceeding these limits results in errors, potentially disrupting vital business processes. The Debug Log meticulously records these operations, making it easier to identify where limits might be breached and guiding developers in optimizing their code accordingly.
3. Monitoring and Optimising Performance:
Performance is key in any software solution. No user wants to sit and wait endlessly for an action to complete. The Debug Log records errors and keeps track of the time taken for operations. This granular detail allows developers to spot inefficiencies or bottlenecks in the code. For instance, if a particular SOQL query consistently takes longer than expected, developers can analyze and optimize it, ensuring users experience faster response times.
4. Tracking and Fixing Errors and Exceptions:
Mistakes happen. Even with rigorous testing, some errors might slip through. The Debug Log assists in these scenarios by recording all exceptions and errors. Instead of sifting through lines of code or recreating designs manually, developers can refer to the log to see the exact point of failure and the associated error message. This considerably reduces the time to fix issues and enhances the platform’s reliability.
5. Auditing and Monitoring User Activities and Interactions:
Beyond code and Performance, Salesforce is also about users—how they interact with the system, their operations, and ensuring their actions align with organizational protocols. The Debug Log can be configured to track specific user activities, making it a vital tool for auditing and compliance. Whether it’s understanding which records a user accessed or verifying if a user’s actions align with set permissions, the Debug Log offers clear visibility.
Advanced Tips for Efficient Debug Log Analysis in Salesforce
Debug logs in Salesforce are a treasure trove of information, but analyzing them effectively requires a strategic approach. Here are advanced tips to maximize the value you derive from debug logs:
1. Leverage Pattern Recognition
- Identify Recurring Issues: Regularly examine logs to spot repeating errors or performance bottlenecks. Patterns such as frequent SOQL timeout warnings or governor limit breaches can signal underlying inefficiencies in your code or configurations.
- Correlate Logs with User Reports: Align user-reported issues with timestamps in the logs to quickly narrow down the root causes.
2. Optimize Trace Flag Usage
- Narrow the Focus: Avoid overwhelming logs with unnecessary data by setting trace flags for specific users, classes, or automated processes. This approach reduces noise and helps pinpoint relevant issues.
- Rotate Trace Flags: Set trace flags for shorter durations and rotate them among users or processes for comprehensive coverage over time.
3. Utilize Log Filtering in the Developer Console
- Custom Filters: Use the Developer Console’s filtering options to focus on specific events like
DML_BEGIN,SOQL_EXECUTE, orEXCEPTION_THROWN. This reduces the effort of sifting through unrelated data. - Highlight Key Metrics: Filter logs to monitor governor limits, such as the number of DML statements or heap size usage, ensuring compliance with Salesforce’s execution limits.
4. Incorporate External Analysis Tools
- Third-Party Log Analyzers: Tools like FuseKit, Illuminated Cloud, or Splunk can visualize log data, highlight anomalies, and provide actionable insights.
- Export Logs for Offline Analysis: Download logs and use text editors or scripting tools (e.g., Python) to parse and analyze them systematically.
5. Monitor Integration Performance
- API Call Tracking: Use debug logs to monitor API call performance and identify latency issues or failures in integrations.
- Optimize External Systems: Analyze logs to ensure third-party systems are sending/receiving data efficiently, minimizing back-and-forth interactions that can degrade performance.
6. Focus on Governor Limits
- Proactive Monitoring: Regularly review logs for near-breaches of Salesforce governor limits. Optimize SOQL queries, batch processes, and triggers to avoid reaching these limits during peak usage.
- Heap Size Insights: Debug logs can reveal memory consumption issues. Monitor heap size usage to prevent out-of-memory errors, particularly in batch jobs or complex processes.

Conclusion
In the intricate world of Salesforce, where businesses manage vast volumes of data, handle dynamic processes, and rely heavily on seamless operations, the importance of Salesforce Debug Logs cannot be understated. These logs serve as the heartbeat monitor of the platform, consistently providing insights into the system’s health, behaviour, and potential anomalies.
Join our Slack group and dive deep into the ever-evolving world of Salesforce, discovering new trends and the latest updates. This space offers a chance for meaningful discussions, exchanging perspectives, and networking with experts in the field.
Moreover, enroll in our online Salesforce bootcamps. Benefit from hands-on training, work on real projects and collaborate with experts. Elevate your Salesforce skills with saasguru. Join Now!
Frequently Asked Questions
1. What are debug logs in Salesforce?
Salesforce Debug Logs are tools within the Salesforce platform that record the background processes when certain actions are executed. These logs are crucial for developers and administrators to troubleshoot issues, understand code behavior, and monitor system performance. They capture detailed information about database operations, user activities, system errors, and Apex executions. Debug logs help in identifying problems in custom code, tracking user operations, and ensuring that Salesforce applications function optimally.
2. How to view Salesforce Debug Logs?
To view Debug Logs in Salesforce, you can navigate to them through the Salesforce Setup. Here are the steps:
- Go to Setup in Salesforce.
- In the Quick Find box, type “Debug Logs”.
- Select “Debug Logs” from the dropdown menu.
- Here, you will see a list of available debug logs. You can view the details by clicking on the specific log you are interested in.
3. How do you enable debug logs in Salesforce?
To enable Debug Logs in Salesforce:
- Go to Setup and type “Debug Logs” in the Quick Find box.
- Click on “Debug Logs”.Use the ‘New’ button to create a new Trace Flag.
- Select the user or Apex class you want to monitor.
- Define the log categories and levels.
- Set the start and end time for the log to capture data.
- Once set up, Salesforce will start recording the debug logs for the specified user or class.
4. How can I get a debug log for the Sites Guest User/Public Profile?
To capture debug logs for a Sites Guest User or Public Profile:
- Go to Setup and enter “Debug Logs” in the Quick Find box.
- Click on “Debug Logs”.
- Create a new Trace Flag.
- For the “Traced Entity Type”, select User.
- In the “Traced Entity Name” field, choose the Sites Guest User associated with the public site.
- Set the log levels and duration.
- Salesforce will start capturing debug logs for actions performed by the Sites Guest User during the specified period.
5. How do you set debug logs for a Process Builder in Salesforce?
To set debug logs for a Process Builder:
- Go to Setup and enter “Debug Logs” in the Quick Find box.
- Click on “Debug Logs”.
- Click the ‘New’ button to create a Trace Flag.
- In the Traced Entity Type, select “Automated Process” from the dropdown. This entity type represents automated processes.
- Set your log levels, particularly focusing on the “Flow” and “Apex” categories to capture the Process Builder’s activities.
- Specify the start and end times for the Trace Flag.
- This setup will capture the logs for actions executed by the Process Builder during the specified period.
6. How to check debug log size in Salesforce?
To check the size of a debug log in Salesforce:
- Navigate to the Debug Logs section in Setup, as previously described.
- Locate the log you want to check and click on the “View” link next to it.
- The log viewer will open. Typically, at the top of the page, Salesforce displays the size of the log file in kilobytes (KB).
- Remember, Salesforce has a limit on the size of debug logs, which is currently 20 MB per log file.
7. How do you increase the debug log size in Salesforce?
You can manage the log size by:
- Adjusting the log levels: Setting lower levels of logging for certain categories like “Debug” or “Info” can help reduce the amount of data logged, thereby managing the size of the logs.
- Focusing on specific operations: By creating more focused Trace Flags, you can limit the amount of data logged. For instance, if you’re only interested in monitoring a specific process or user activity, adjust your Trace Flags accordingly.
- Regularly reviewing and clearing logs: Regular maintenance of your debug logs by deleting older or unnecessary logs can help manage overall log volume.